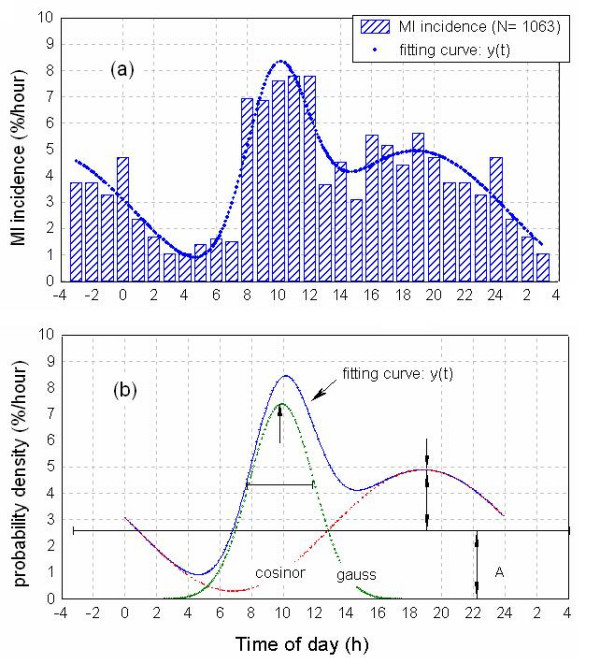
Figure 1.

Circadian periodicity in MI incidence in the population examined. Upper panel (a): Bars indicate MI incidence (%/h) values, calculated as (100 * MI's per hour/total N). Curve fitting = cosinor + Gaussian for n = 24 time points was calculated as described in Methods. Values for 21:00 – 24:00 h (left) and 01:00 – 03:00 h (right) are duplicated to illustrate fitting function. Lower panel (b): Probability density functions (%/h) for MI incidence in total population. Cosinor and gaussian components are shown separately to illustrate the contribution of each parameter in fitting the function y(t).
