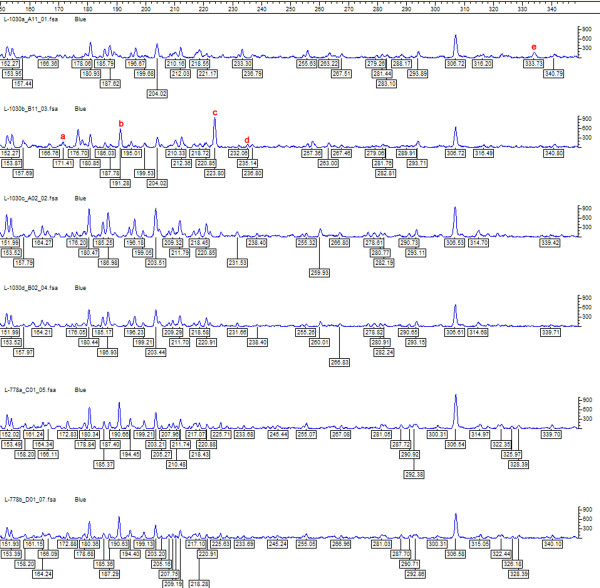
Figure 2.
S. epidermidis strain specific FAFLP electropherograms depicting the range between 150–350 bp for MseI+A selectivity tested, showing number and fragment sizes as well as the peak heights. The genotyper plots of paired isolates from patient 1 and patient 3. FAFLP patterns in order (top to bottom) are L-1030a, L-1030b, L-1030c, L-1030d, L-778a, and L-778b. Polymorphic fragment in L-1030a designated as 'e' in the figure (333 bp); polymorphic fragments in L-1030b designated as a, b, c, d (171, 191, 223, 235 bp).

