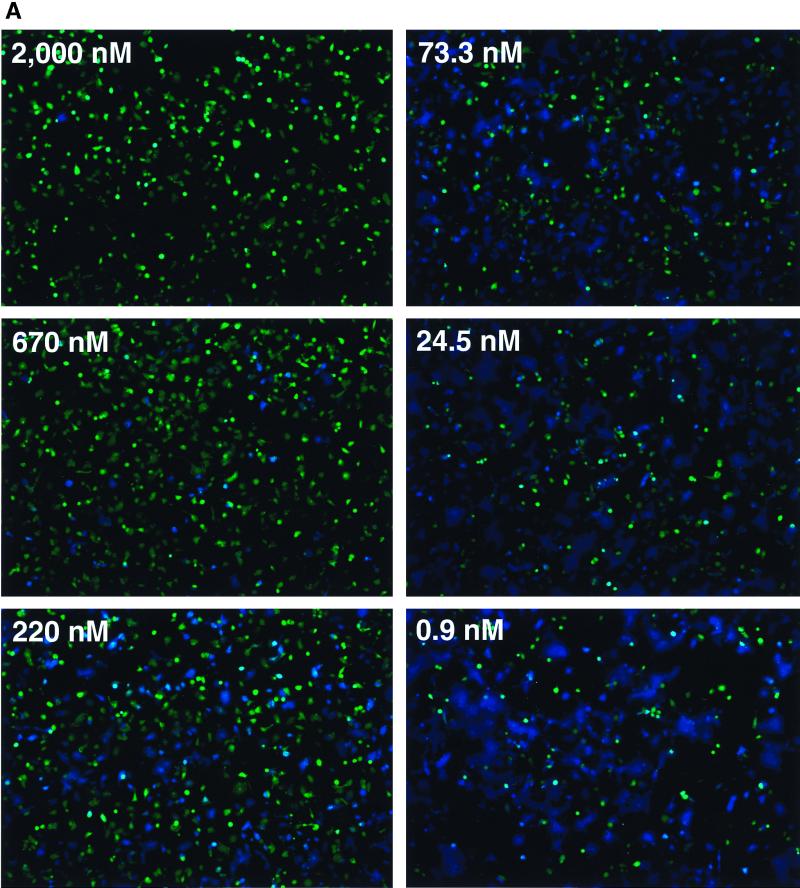
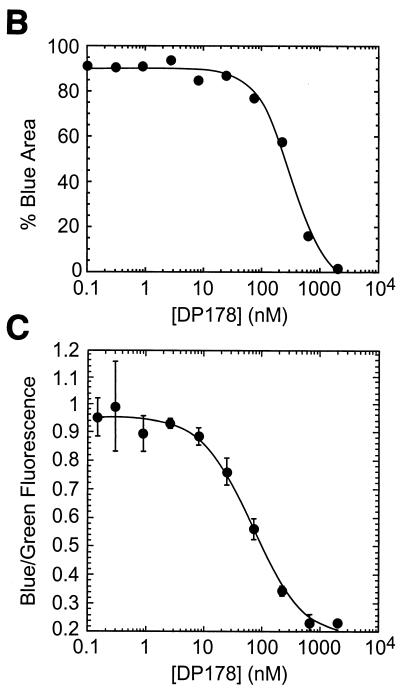
FIG. 5.
The extent of fusion can be measured accurately using a microplate fluorometer. CCF2-loaded HeLa cells expressing gp120/gp41 from the Sf162 HIV strain were incubated at 37°C with SupT1/CCR5/BlaM clone C6 in the presence of various concentrations of peptide DP-178. Each inhibitor concentration was tested in quadruplicate. After 2 h of incubation, the extent of fusion was assessed by image analysis and by measurement of green and blue fluorescence in a microplate fluorometer. (A) Images of wells incubated in indicated concentrations of DP-178. Six representative images are shown; four images were collected for every concentration of DP-178 tested. (B) Results of digital image analysis. The extent of fusion for each condition was assessed by measuring the percent of maximal blue pixels in each image (see Materials and Methods). (C) Results of fluorometry. Here, the extent of fusion is given by the ratio of blue to green fluorescence, with each point plotted as the mean ± 1 standard deviation. The IC50s for both B and C were determined by nonlinear curve fitting using a four-parameter logistic equation as described in Materials and Methods.


