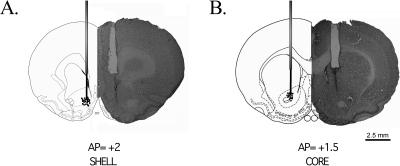
Figure 1.
A photomicrograph of a coronal section of the rat brain stained with cresyl violet and a diagram of the cannulae location from the NAcc shell (A, AP=+2 ± 0.3 mm from Bregma) or the NAcc core (B, AP = +1.5 ± 0.3 mm from Bregma) during microinjection. The points represent the localization of the cannulae.

