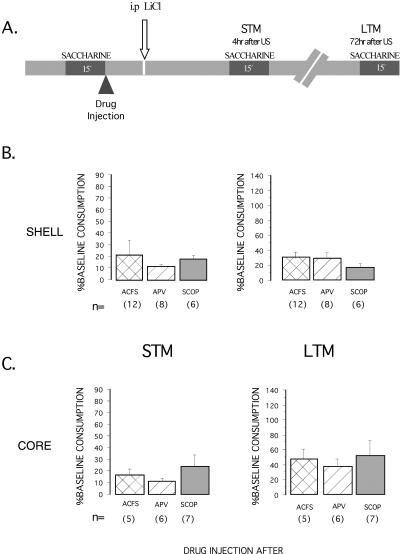
Figure 3.
(A) A representation of experimental protocols used to study the aversive TMT (post-training injection) and percentage of baseline consumption (mean ± SEM) on short and long-term test memory, for the NAcc shell (B) and the NAcc core (C). The figure shows the effects of APV and scopolamine microinjections immediately after taste presentation of CTA. No significant differences among groups were found in saccharine consumption on the test of STM and LTM.

