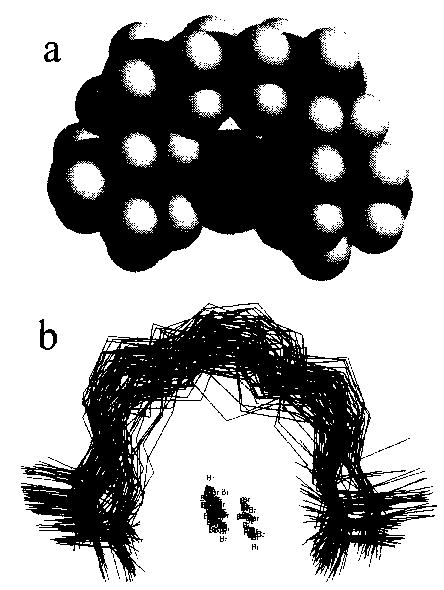
Fig. 9.

(a) Space filling representation of the lowest energy structure of decamethonium bromide, showing the bromide ion (labeled) surrounded by the decamethonium ion, with nitrogen, carbon, and hydrogen indicated in grayscale dark to light, respectively, (b) A stick plot of the lowest energy structures of each of the 79 groups of structures from the Monte Carlo conformational search.
