
Fig. 11.
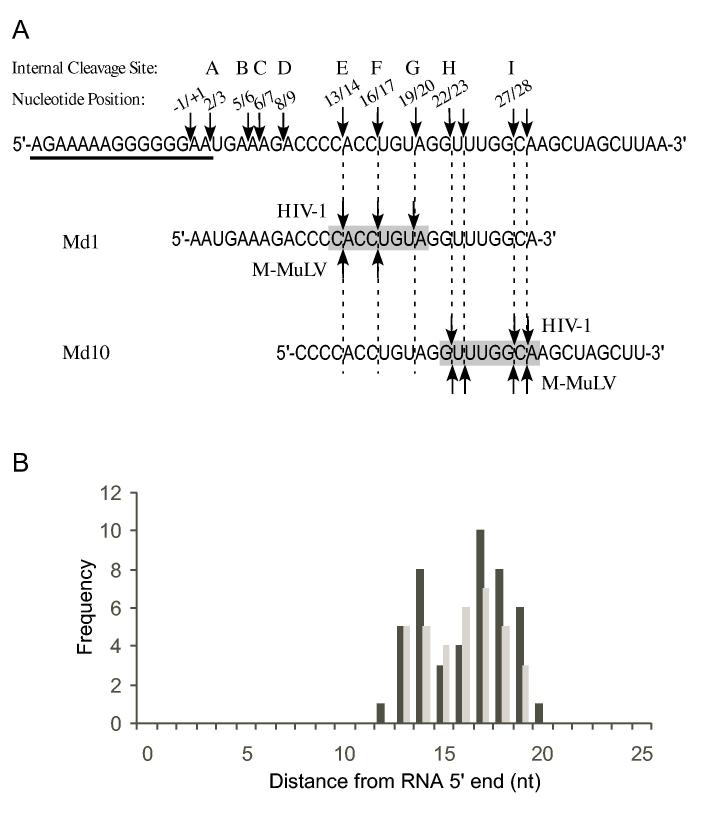
“Cleavage Window” model for sequence and distance as determinants of 5′ end-directed cleavage. (A) The sequence of the M-MuLV region surrounding the -1/+1 site is shown, beginning at -20 and ending at +40, with the PPT underlined. In this sequence, the locations of the most prominent internal cleavage sites recognized by M-MuLV or HIV-1 reverse transcriptase (23) are indicated by arrows. Above each arrow is the 5′ and 3′ nucleotide positions bordering the cleavage site and the letter designation given to that site. Site C is an internal cleavage site recognized by HIV-1 RNase H that is not observed in 5′ end-directed cleavages, possibly because it is too close to the 5′ end. The sequences of Md1 and Md10 are aligned below with vertical dashed lines indicating the positions of 5′ end-directed cleavage sites. The “cleavage window” that defines eligible sites for 5′ end-directed cleavage is indicated by the shaded box. (B) A frequency distribution plot relative to specific positions that are used for 5′ end-directed cleavages for HIV-1 (black bars) or M-MuLV (grey bars), based upon the 46 sequences shown for HIV-1 in Fig. 5 and the 35 sequences shown for M-MuLV shown in Fig. 6.