
Fig. 2.
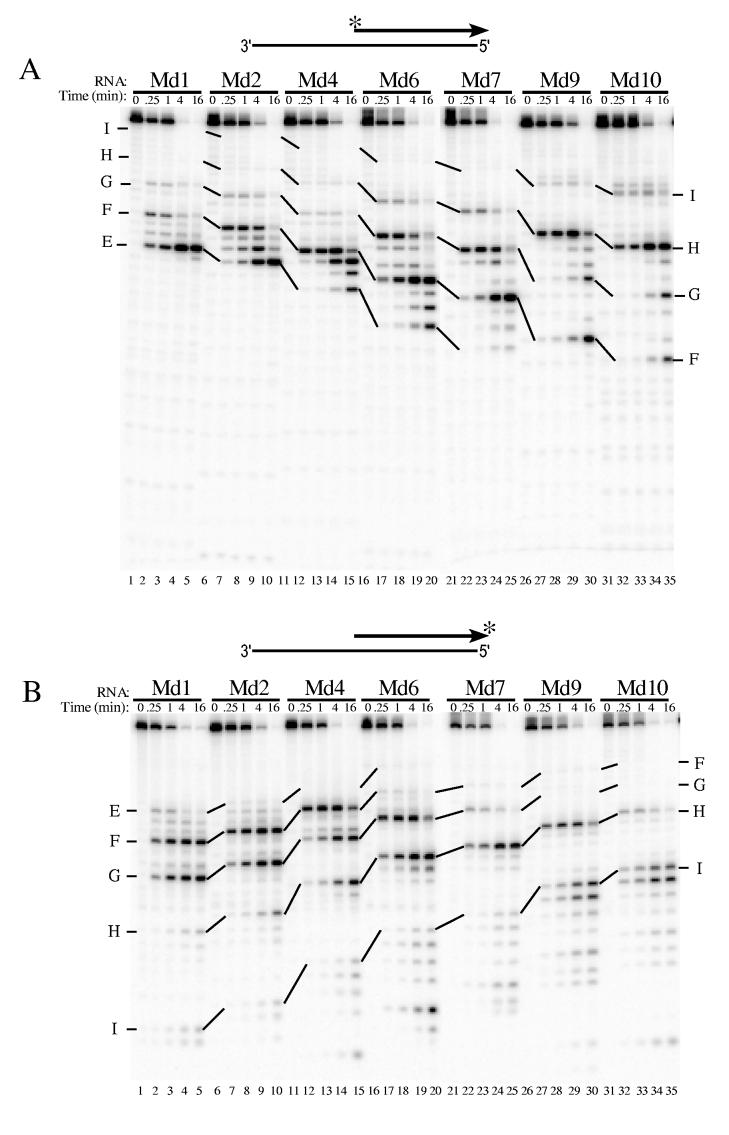
Analysis of 5′ end-directed RNase H cleavages in RNAs Md1 through Md10 using HIV-1 reverse transcriptase. The hybrid substrate (thick line RNA) shown schematically at the top of each panel contained the indicated 5′ end-labeled (A) or 3′ end-labeled (B) RNA. Substrates were treated with HIV-1 reverse transcriptase, aliquots were removed at the indicated times, and samples were analyzed in denaturing 20% polyacrylamide gels. Results were visualized using a Phosphorimager. Products resulting from cleavage at specific sites in Md1 are labeled as sites E — I, and solid lines track cleavage products corresponding to products from cleavage of the same sites in the other substrates. In Md1 (see Fig. 1), the cleavage sites are found between the following nucleotides from the RNA 5′ end: site E is +13/+14, site F is +16/+17, site G is +19/+20, site H is +22/+23, and site I is +27/+28. The cleavage sites identified in Md1 that give rise to the cleavage products shown for Md10 are indicated at the right.