
Fig. 7.
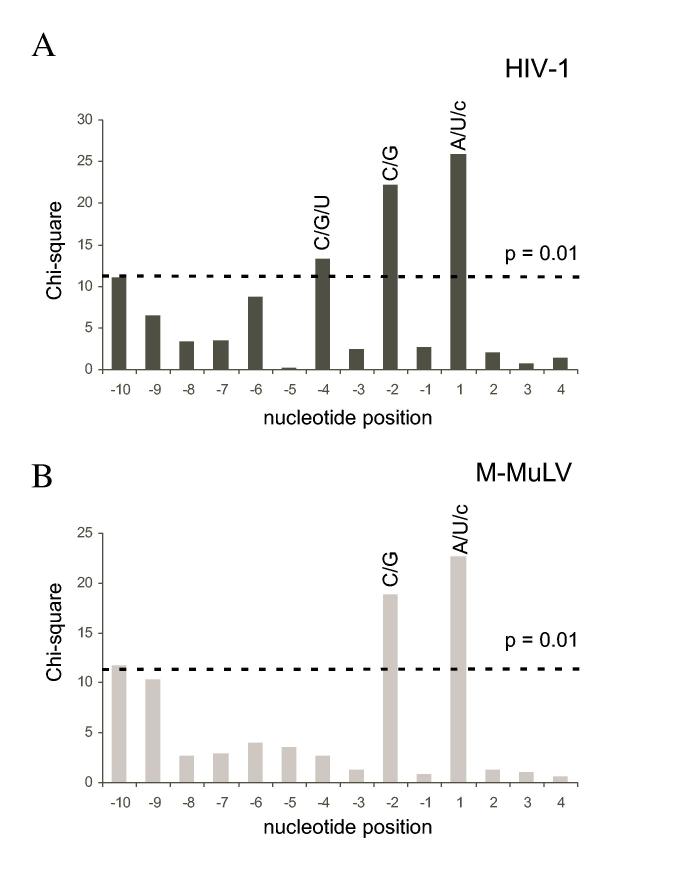
Base preferences at nucleotide positions flanking strong and medium RNA 5′ end-directed cleavages sites. The chi-square values of the nucleotide distribution from positions -10 to +4 were calculated by comparison to overall base frequencies and plotted as a function of nucleotide position, with the cleavage site located between positions -1 and +1. (A) Analysis of the 46 sites for HIV-1 shown in Fig. 5. (B) Analysis of the 35 sites for M-MuLV shown in Fig. 6. The dashed line indicates the chi-square value of 11.34, which has a p value of 0.01. Nucleotide positions with scores exceeding 11.34 are considered significant. The preferred nucleotides for each of the significant positions are indicated above the corresponding bar in upper case (strongly preferred) or lower case (acceptable) letters.