
Figure 1.
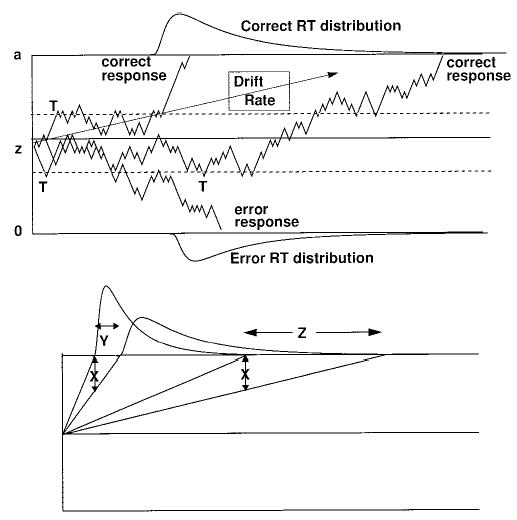
An illustration of the diffusion model. The top panel shows three sample paths (derived from a random walk approximation to the diffusion process) and the effect of moving the boundaries from the solid lines to the dotted lines (where the processes terminate at the points marked T). The bottom panel illustrates the effect on response time (RT) distributions of reducing the drift rate for the fastest and slowest finishing processes by the same amount, X. The fastest responses slow by Y, and the slowest responses slow by Z, which means that longer mean response times result mainly from the distribution skewing.