
Figure 3.
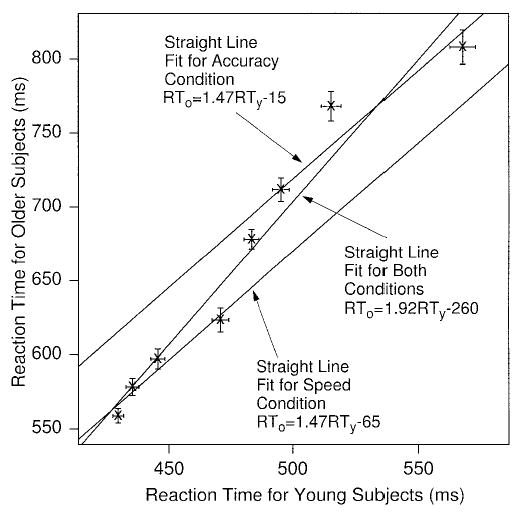
Brinley functions for correct response times (RTs) for the experiment. The points on the graph represent the same conditions for older and young subjects. Straight lines are fitted for speed and accuracy conditions separately and for the conditions combined. Error bars are 2 SEs in mean RT. The four data points in the bottom left of the figure are for the speed conditions, and the four data points in the top right of the figure are for the accuracy conditions.