
Figure 4.
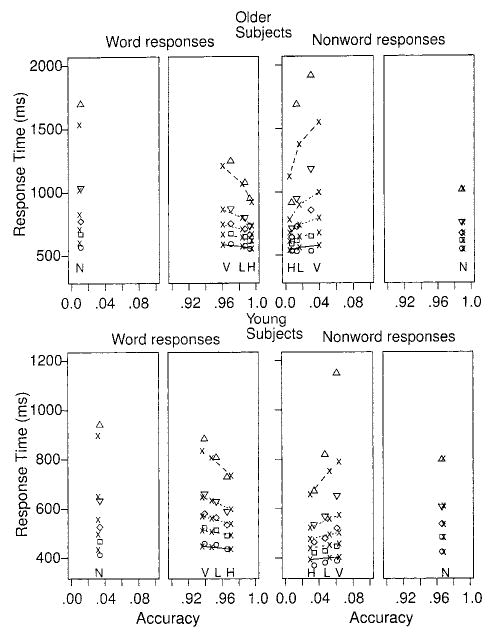
Quantile probability plots for Experiment 2. The lines and x symbols represent the theoretical fits of the diffusion model, and the triangles, diamonds, squares, and circles represent the empirical quantile response times (RTs). The lines in order from the bottom to the top are for the .1, .3, .5, .7, and .9 quantile RTs. The symbols H, L, V, and N below the .1 quantile RTs identify the high-, low-, and very low-frequency word conditions and the nonword condition, respectively.