
Figure 2.
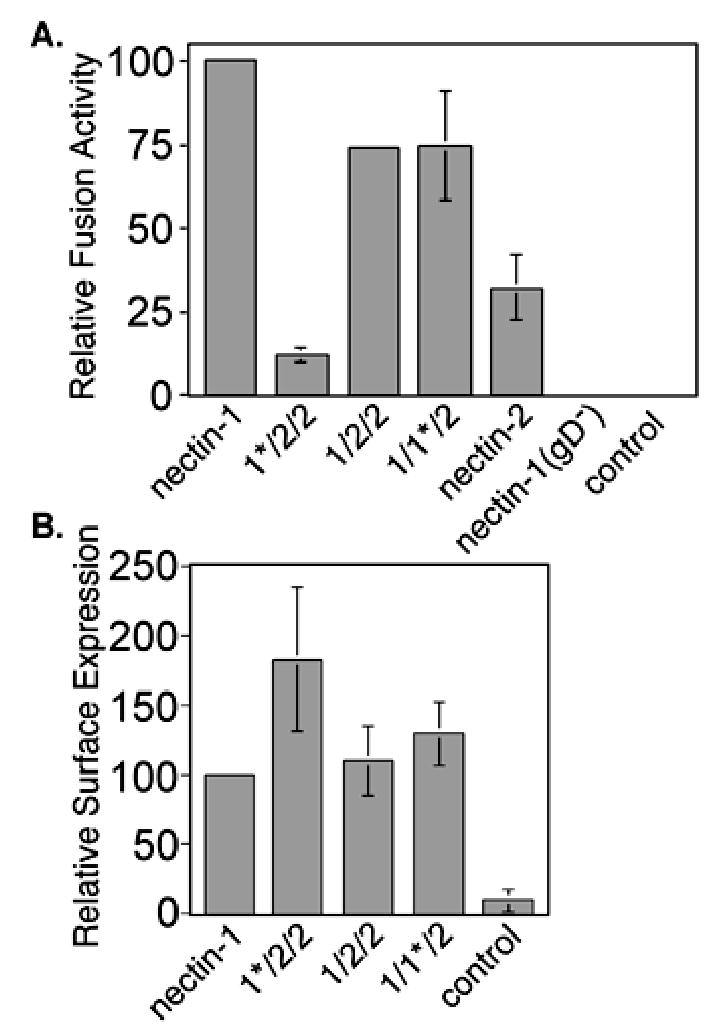
Fusion activity of nectin-1α/nectin-2α chimeras in a cell-mixing fusion assay. (A) Fusion assay. CHO-K1 cells expressing gB, gD, gH, gL, and T7 polymerase, or control plasmid pCAGGS substituted for gD plasmid (gD−), or all control plasmid (control) were mixed with CHO-K1 cells expressing nectin-1α or chimera and pG1NT7β-gal. Within each experiment, all values were expressed as a percentage of the value obtained for the positive control (nectin-1). (B). Cell-surface expression of chimeras in the fusion assay. CELISA analysis of receptor expressing cells from (A) using the nectin-1 mAb CK6. Within each experiment, all values were expressed as a percentage of the value obtained for the positive control (nectin-1). The absence of error bars for relative values given is due to standard deviations too small to generate a visible error bar. The fusion/CELISA experiments were performed three times and the mean values plus standard deviations for the combined relative results are depicted.