
Figure 6.
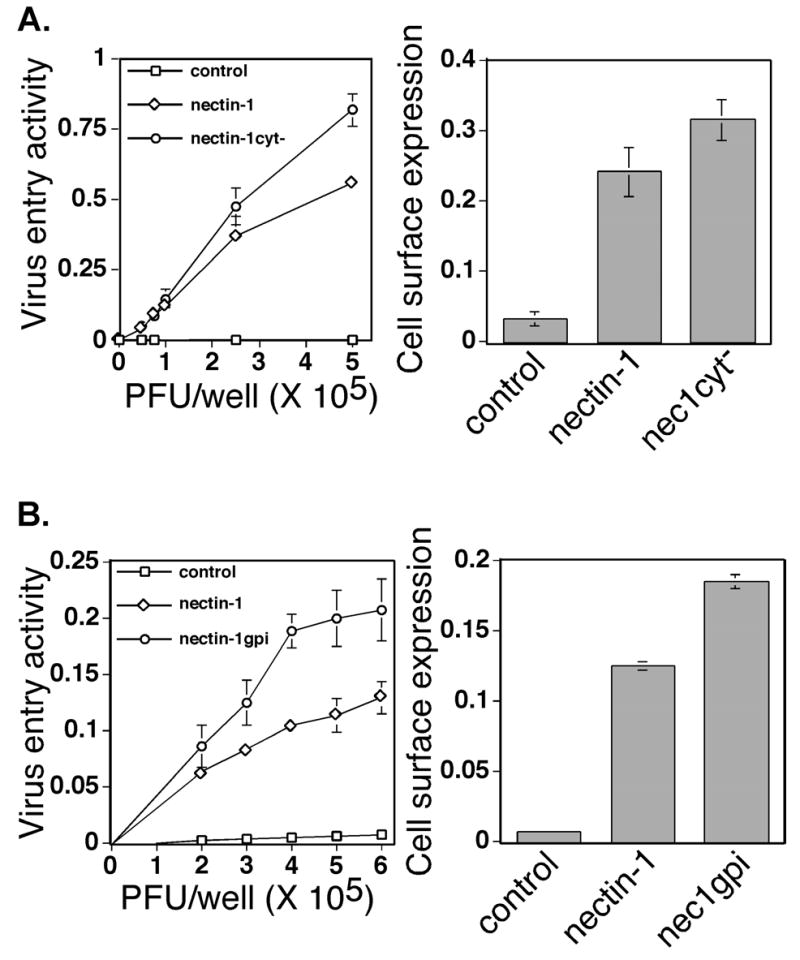
HSV-1 entry activity and surface expression of the nectin-1α mutants nectin-1cyt− (A) and nectin-1gpi (B). CHO-K1 cells were transfected with plasmids expressing the proteins indicated or with a control plasmid and then replated in 96 well plates. The next day the cells were inoculated with an HSV-1 recombinant expressing β-galactosidase. Six hrs after inoculation, cells were lysed and β-galactosidase activity determined as a measure of virus entry. The assays were performed in triplicate and repeated three times with similar results. The mean values plus standard deviations for representative experiments are depicted. The graphs on the right represent CELISA analysis with anti-nectin-1α mAb CK6 to detect cell surface expression of nectin-1 or mutant on transfected cells used in the entry assay. The assays were performed in triplicate and repeated three times with similar results. The mean values plus standard deviations for representative experiments are depicted.