
Figure 7.
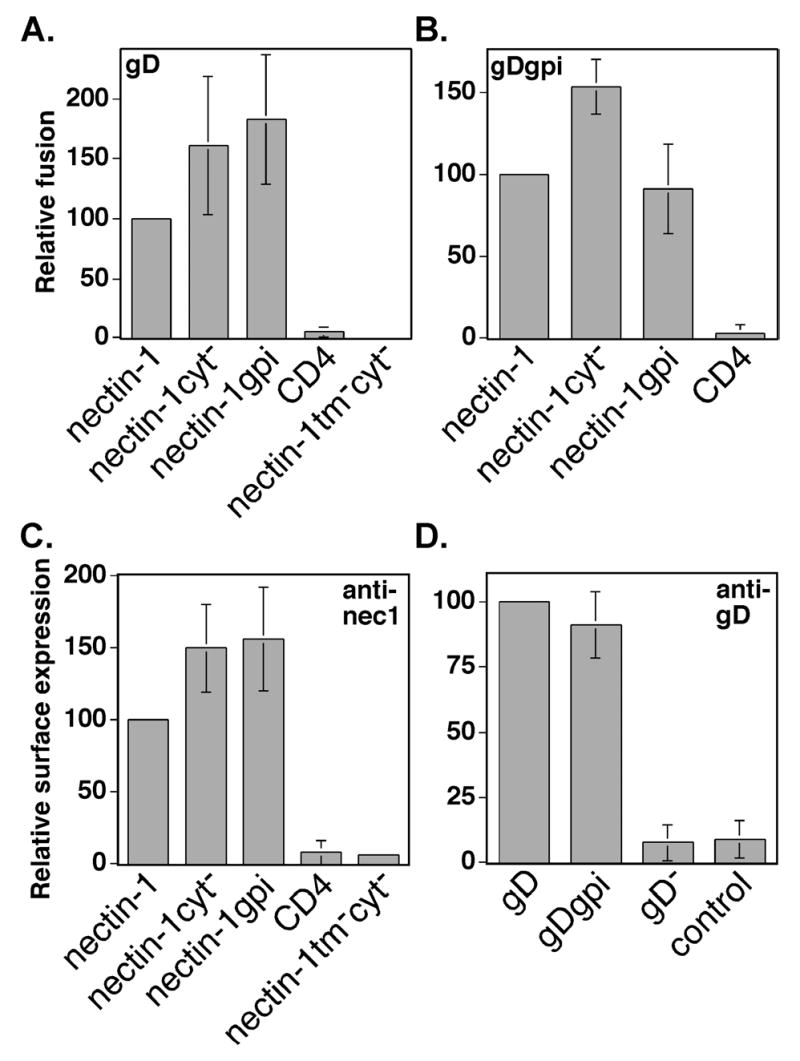
Fusion activity of nectin-1α mutants using gD or gDgpi. (A) Fusion assay using wild-type gD. CHO-K1 cells expressing gB, gD, gH, gL, and T7 polymerase were mixed with CHO-K1 cells transiently expressing nectin-1α or mutant and pG1NT7β-gal. Within each experiment, all values were made relative to the value obtained for the positive control (nectin-1). (B) Fusion assay using gDgpi. CHO-K1 cells expressing gB, gDgpi, gH, gL, and T7 polymerase were mixed with CHO-K1 cells expressing nectin-1α or mutant and pG1NT7β-gal. Within each experiment, all values were expressed as a percentage of the value obtained for the positive control (nectin-1). (C) Cell-surface expression of nectin-1α mutants in the fusion assay. CELISA analysis of cells from (A) and (B) using the nectin-1 mAb Prr1-PE (anti-nec1). Within each experiment, all values were expressed as a percentage of the value obtained for the positive control, nectin-1. (D) Cell-surface expression of gD and gDgpi in the fusion assay. CELISA analysis of cells from (A) and (B) using the rabbit polyclonal anti-gD serum R7 (anti-gD). Cells transfected with plasmids expressing gB, gD, gH, gL, and T7 (labeled gD), or gB, gDgpi, gH, gL, and T7 (labeled gDgpi), or gB, gH, gL, control plasmid pCAGGS, and T7 (labeled gD−) or control plasmid pCAGGS (labeled control). Within each experiment, all values were expressed as a percentage of the value obtained for the positive control, gD. The fusion/CELISA experiments were performed at least three times and the mean values plus standard deviations for the combined relative results are depicted.