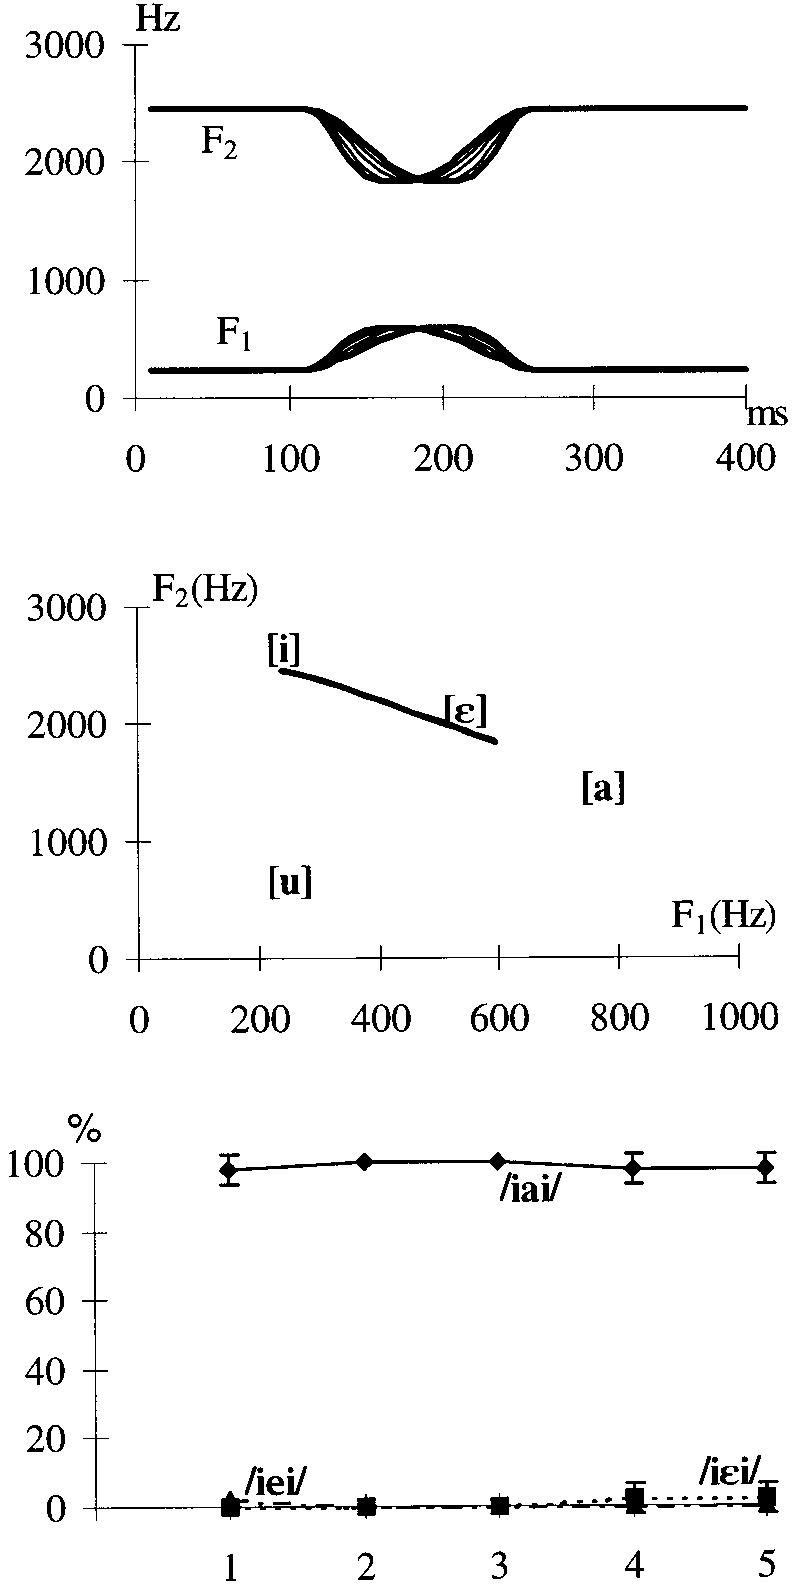
Fig. 4.

Experiment 1c. a Spectrogram representation of the five different temporal patterns of the formant transitions; note that the transition for all tokens reaches the same V2 and that the total duration of the transition is always constant at 150 ms. b F1-F2 plane representation of the transitions: note that the extreme value, i.e. the V2 vowel corresponds to the formant values of the vowel [ε]. c Average labeling results (and standard deviation) of 5 listeners in experiment 1c for V2 in a [iai] context with changing transition durations. Ordinate: percent responses; V2 = /a/ (filled diamonds), V2 = /ε/ (squares), V2 = /e/ (triangles). Abscissa: Token numbers corresponding to the five different transition slopes (a).
