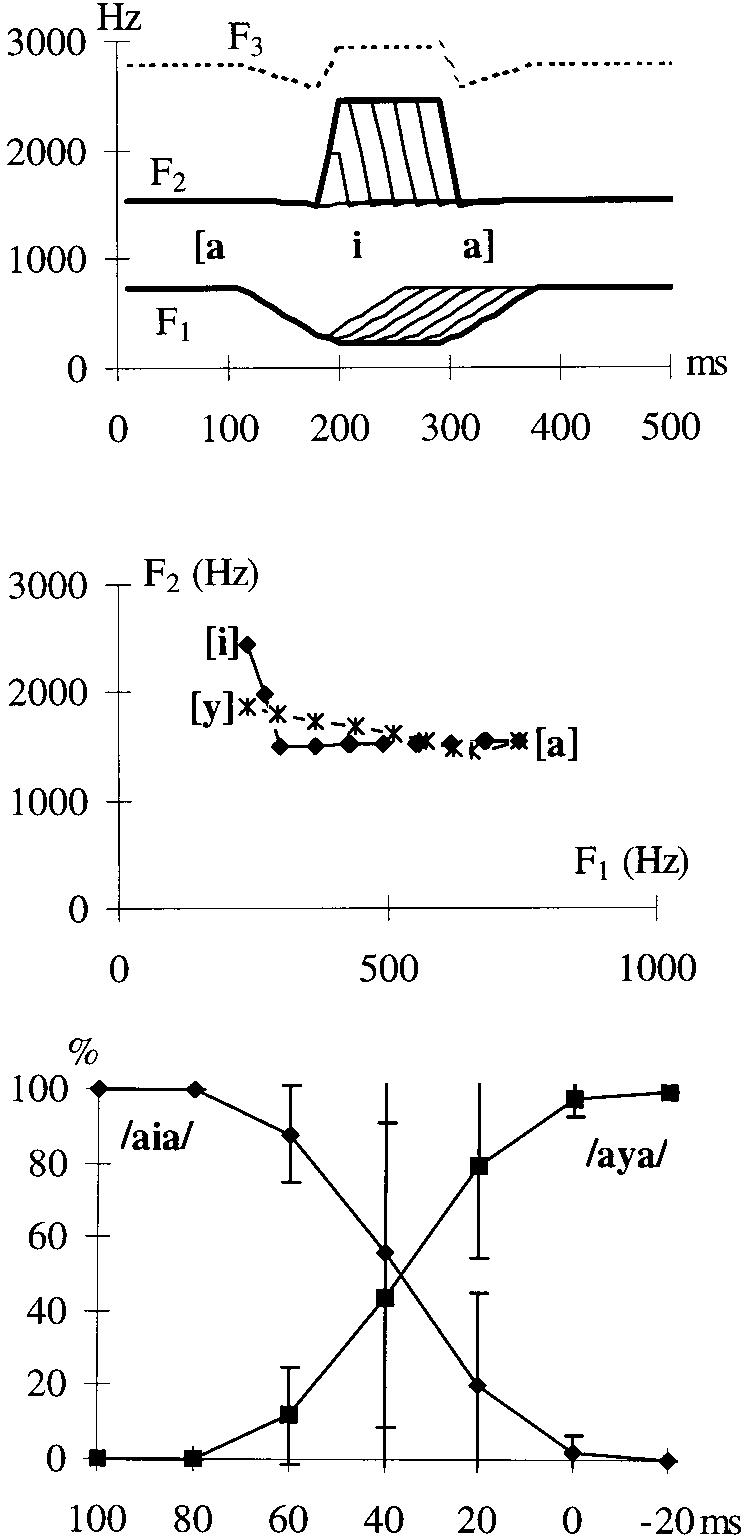
Fig. 8.

Experiment 2d. a Temporal representation of the F1 and F2 transitions of the seven tokens used in the [aV2a] experiment where six tokens completed the transition to the vowel [i]. The last one had its transition cut back, i.e. its formant frequencies returned toward those of [a] after reaching V2 endpoint vowel on the trajectory. The temporal representation of F3 is also shown (dotted line) for the case in which the [i] target is reached. b F1-F2 plane representation of the [aia] transition for the seven tokens used in experiment 2d (solid line). Note that, compared with the [aya] trajectory (broken line) shown in figure 7b, the trajectory is also curved but reaches [i]. c Results of experiment 2d: Percent /aia/ (filled diamonds) and /aya/ (squares) responses as a function of the duration of [i] or the transition cutback point (i.e. the point of return to [a]) where 0 ms refers to the condition in which the vowel [y] is reached but the transition immediately returns toward [a].
