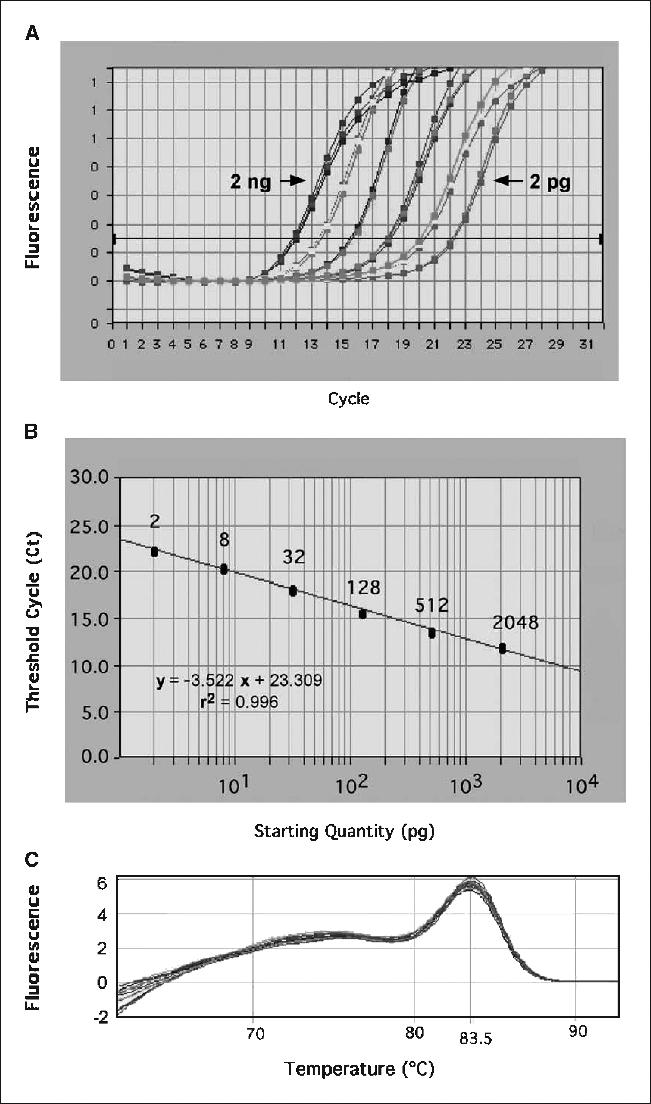
Figure 1.
Quantification of human Alu sequences by real-time quantitative PCR. A, real-time amplification plot done to determine cycle threshold values (intersect at horizontal line) using serial 4-fold dilutions of human genomic DNA (2-2,048 pg) mixed with 60 ng of mouse genomic DNA. B, standard curve created using triplicate measurements for each dilution and calculated using the threshold cycles indicated in (A). C, dissociation curves of the human-specific Alu sequence amplicons.

