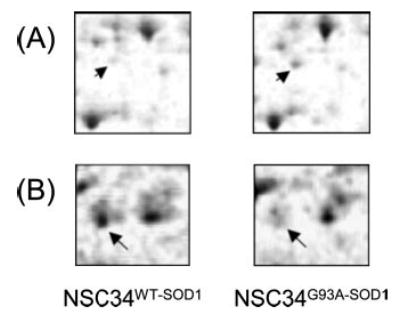
Fig. 5. Representative 2D gel protein spots that displayed differential levels between NSC34WT-SOD1 and NSC34G93A-SOD1 cells.
A, the protein named “Similar to septin6 type II” (spot 125 in Fig. 2) has increased abundance in NSC34G93A-SOD1 cells (NSC34G93A-SOD1/ NSC34WT-SOD1 = 1.97, p = 0.019). B, the protein “Heat shock 70-kDa protein 5” (spot 64 in Fig. 2) has decreased abundance in NSC34G93A-SOD1 cells (NSC34G93A-SOD1/NSC34WT-SOD1 = 0.58, p = 0.038). Forty-five 2D gel spots display altered abundance between the mitochondrial fractions isolated from NSC34WT-SOD1 and NSC34G93A-SOD1 cells. These 45 protein spots were identified as 40 unique proteins, and they are listed in Table II.

