
Figure 3.
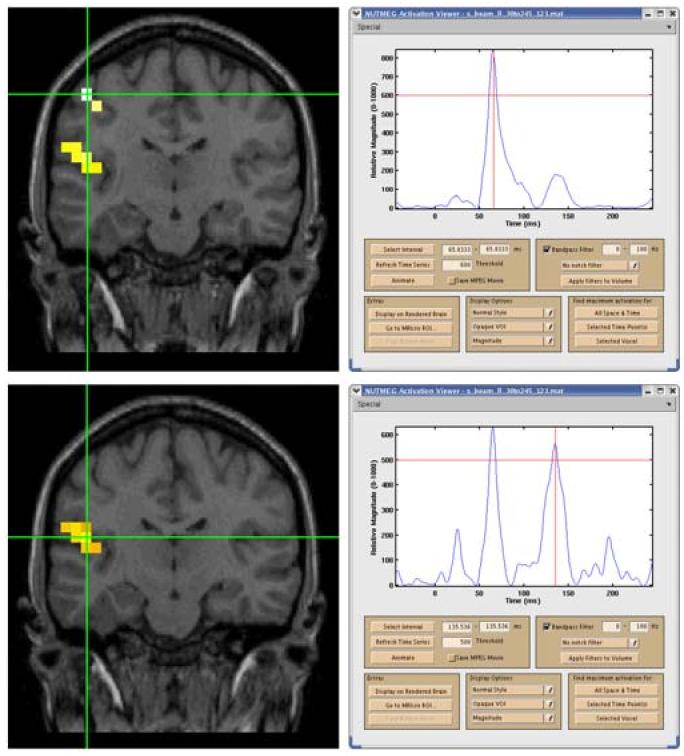
Beamformer reconstruction of evoked tactile stimulation of right D2 showing time series and localization for S1 at 66 ms (top) and S2 at 136 ms (bottom); note S2 also shows activity at 66 ms (slice has been tilted to include both S1 and S2). The peak at 20 ms is due to stimulus artifact.