
Fig. 5.
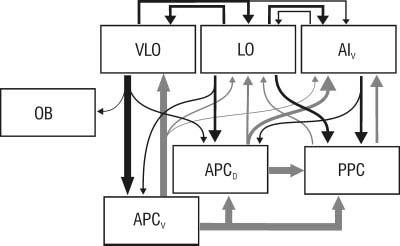
Schematic diagram and summary of results. Projections within OFC and from OFC to piriform cortex revealed by PHA-L injections in the present study are shown in black, with the width of the arrow representing the relative size of the projection. Projections among areas within piriform cortex, and from piriform cortex to OFC, are shown in gray and represent previously reported findings. For simplicity, projections from the OB are not shown.