Fig. 5.

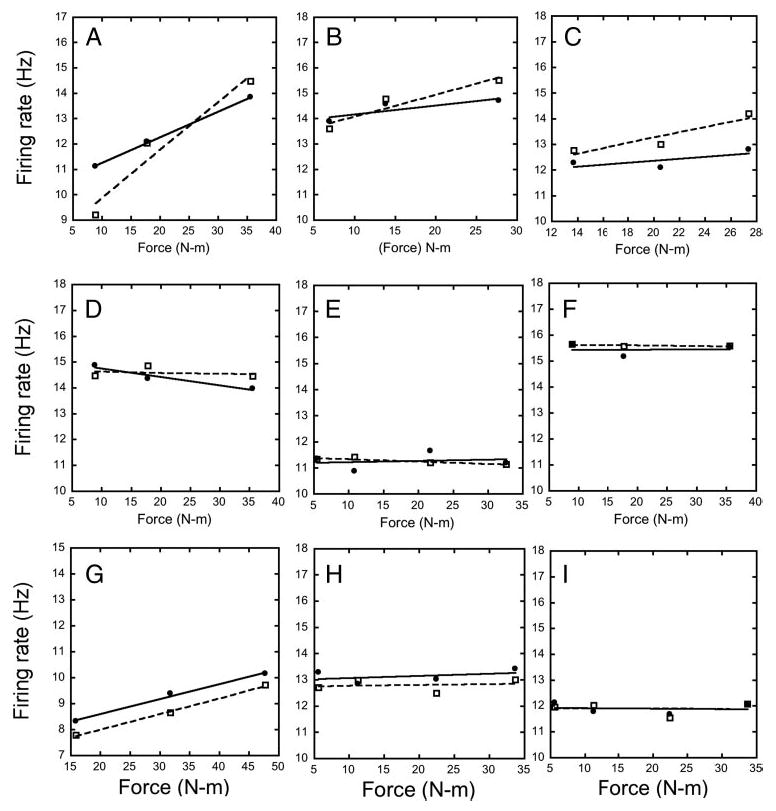
Examples of firing rate changes of individual motor units at successive force levels during contraction alone (—) and with vibration (- - -) from control subjects (A–C) and PLS patients (D–I).

Examples of firing rate changes of individual motor units at successive force levels during contraction alone (—) and with vibration (- - -) from control subjects (A–C) and PLS patients (D–I).