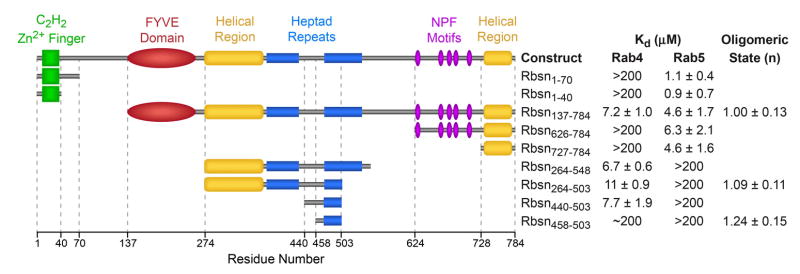
Figure 1.
Mapping of the Rabenosyn-5 Rab GTPase binding domains. Mean Kd values and standard deviations were obtained from 2–4 SPR experiments using purified Rab GTPases and Rabenosyn-5 constructs. The oligomeric state (n = 1 for monomer; n = 2 for dimer) was determined from sedimentation equilibrium experiments over the concentration range from 5 – 50 mM. Values represent the mean and standard deviation for 3 measurements.

