
FIGURE 10.
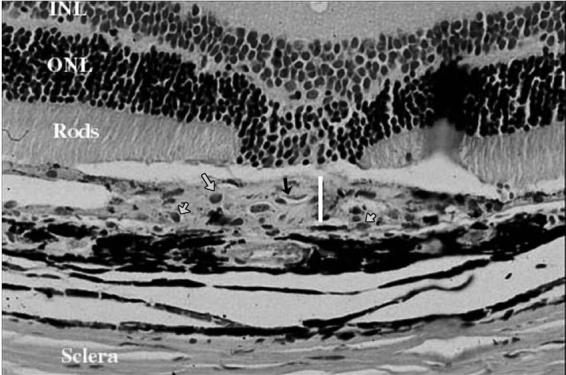
Light Microscopy of a Leaking Laser Spot in a Treated Eye 4 Weeks After Laser Showing a Thinner Fibrovascular Complex (White Line) Compared to Controls. The proliferating new blood vessels are also less dense and lack RBCs inside their lumen (black arrow). The density of infiltrating macrophages (gray arrows) is the same as in control eyes. (H & E stain, original magnification X = 130).