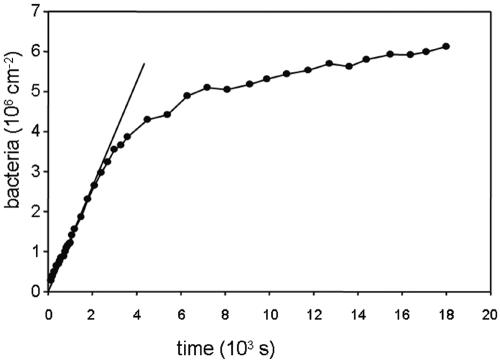
FIG. 1.
Example of deposition kinetics as a function of time in a parallel plate flow chamber, reaching a (pseudo-) end stage for Enterococcus faecalis OG1X on fluoroethylenepropylene in phosphate-buffered saline, pH 7.0, at a concentration of 3 × 10⁸ bacteria per ml and a wall shear rate of 10 s−1. The tangent shows the linear trajectory from which the initial deposition rate is calculated.

