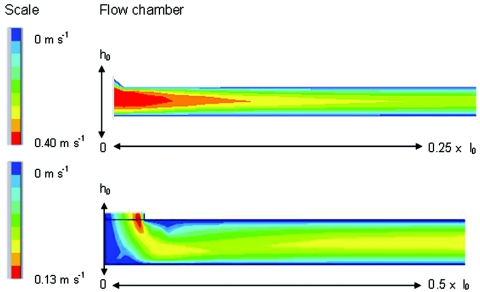
FIG. 9.
Modeled velocity profiles in longitudinal cross section from the inlet to the center of parallel plate flow chambers. Top chamber A shows a well-developing profile that has become established within 25% of the length of the chamber (no more changes in color or color widths), whereas the bottom chamber B continues to develop over more than half the length of the chamber. Scale colors indicate flow velocities. (Reprinted from reference 4.)

