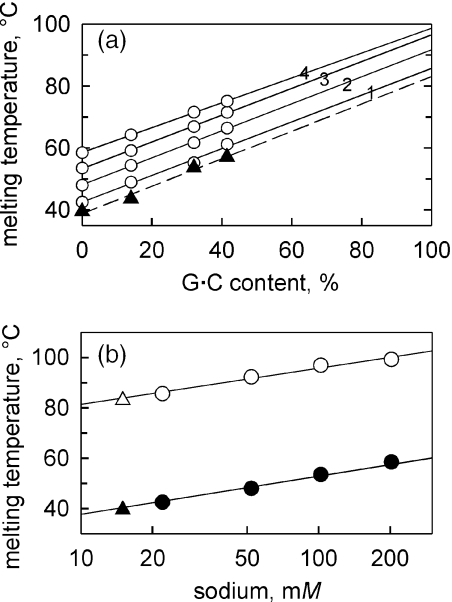
Figure 4.
Stability of DNA under different salt conditions. (a) Dependence of TM of 65 bp-long DNA duplexes on their G•C content in 1× TBE (triangles, dashed line) and in 10 mM TE (pH 7.4) (circles, solid lines) appended with NaCl at 20 mM (line 1), 50 mM (line 2), 100 mM (line 3) and 200 mM (line 4). Linear extrapolation to χ = 100% is used to estimated TM of G•C-containing DNA. (b) Stability of A•T-containing (open symbols) and G•C-containing (closed symbols) 65 bp-long duplex DNA as a function of sodium concentration (circles) and in 1×TBE (triangles). TM's of A•T-containing DNA were measured directly; TM's of G•C-containing DNA were estimated by extrapolation shown in (a). For both duplexes, stability in 1× TBE corresponds to the stability in the presence of 15 mM Na+ (as plotted).

