
Fig. 1.
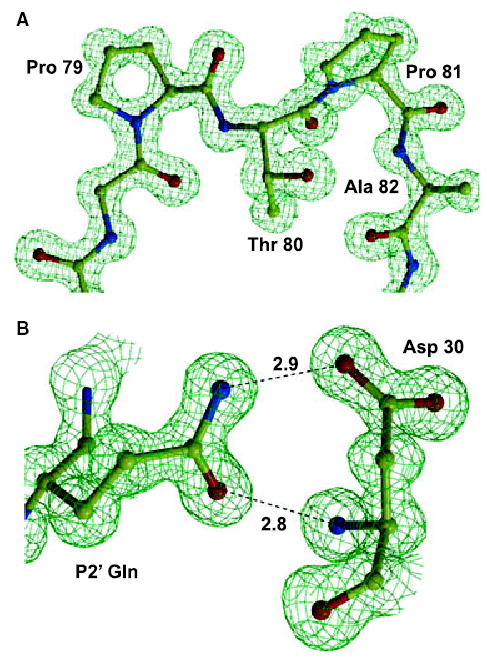
Electron density map of HIV-1 protease with the V82A mutation (PRV82A)–p2-NC crystal structure. The 2Fo–Fc map was contoured at a level of 2.2σ. Hydrogen bond interactions are shown with distances in Å. (A) Residues 78–82. (B) Asp30 interacting with P2′ Gln.