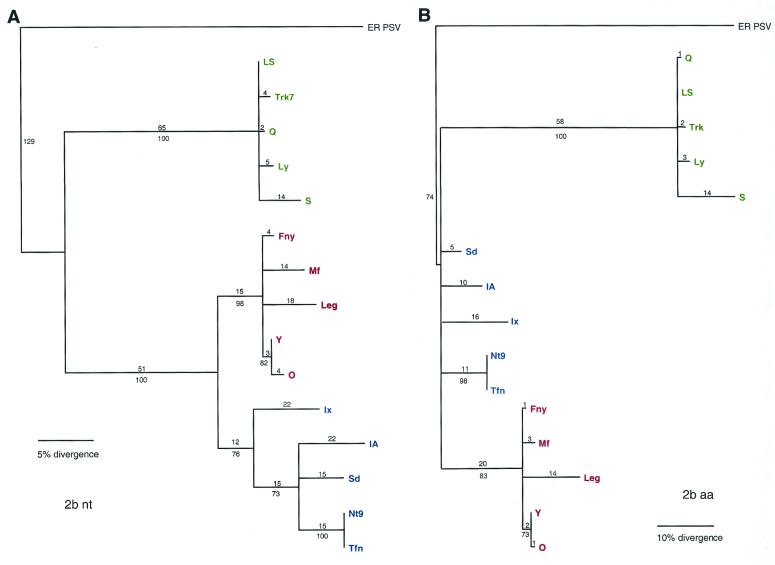
FIG. 5.
Phylogenetic analysis of the 2b ORF, with aligned nucleotide sequences (A) and aligned amino acid sequences (B). Strains designated in green are from subgroup II, strains designated in blue are from subgroup IB, and strains designated in red are from subgroup IA. Bootstrap percentage values are shown below the branches, and the distance, in number of nucleotide (nt) or amino acid (aa) changes, is shown above the branch lines.

