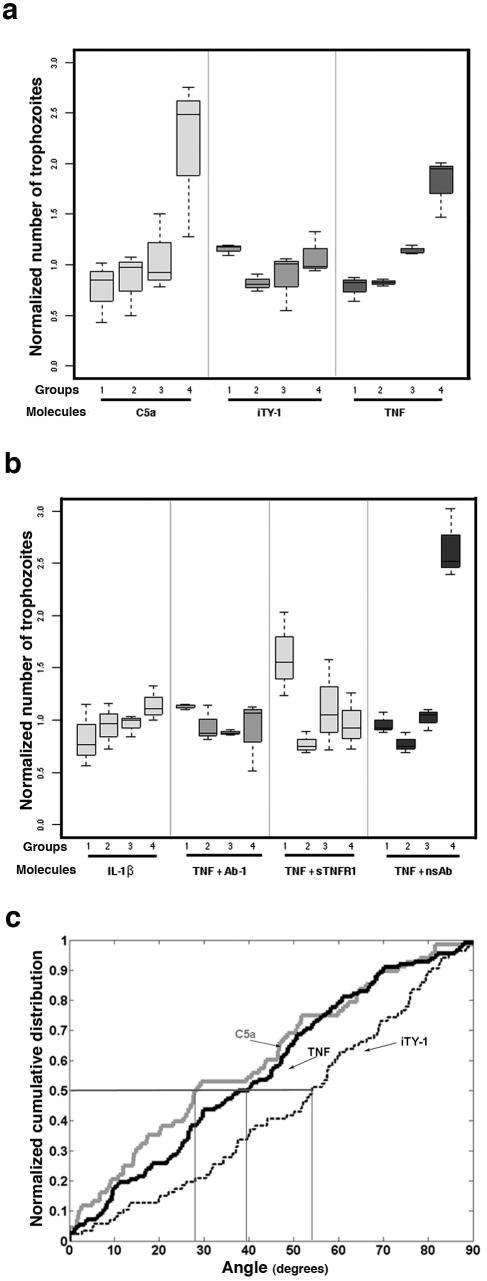
FIG. 2.
TNF has a chemoattractant effect on E. histolytica. The displacement of the E. histolytica population was analyzed after 2 h of incubation in the presence of different molecules. The box plot shows the distribution of cells along the coverslip in groups 1 (fields 1 to 6), 2 (fields 7 to 11), 3 (fields 12 to 17), and 4 (fields 18 to 22). A one-way analysis of variance allowed us to compare the difference in amebae numbers between groups. (a) In the absence of a chemoattractant (agarose with iTY-1 [without serum]), the population was distributed homogeneously along the coverslip (P = 0.8). When the agarose slice was filled with C5a (6 nM) or TNF (50 nM), there was a displacement of the population up the gradient toward the test molecule source (C5a, P = 8.7 × 10⁻³; TNF, P = 1.6 × 10⁻⁴). In addition, a pairwise comparison using t tests between groups was applied. In the C5a gradient, the mean ameba number was significantly different between groups 1 and 4 (P = 0.008), groups 2 and 4 (P = 0.011), and groups 3 and 4 (P = 0.025), with an accumulation of amebae near the source of C5a. The mean per group increased along the gradient of TNF and was significantly different between groups 1 and 3 (P = 0.025), groups 1 and 4 (P = 0.015), groups 2 and 3 (P < 10−4), and groups 2 and 4 (P = 0.03). In contrast, for iTY-1 no significant difference between groups was found, in accord with an absence of chemotactic migration. (b) In the presence of a gradient of IL-1β (source, 50 nM) there was no displacement of the population (P = 0.08). When TNF (50 nM; 0.88 μg/ml) was incubated with a monoclonal anti-TNF antibody (500 μg/ml) (TNF + Ab-1) or with the soluble TNF receptor I (4 μg/ml) (TNF + sTNFRI) prior to injection into the agarose cube, chemotaxis was abrogated (P = 0.14 and P = 0.16, respectively). However, when TNF was incubated with a monoclonal antibody (500 μg/ml) not specific for human TNF (TNF + nsAb), chemotaxis toward the TNF source was not inhibited (P = 0.003). Total numbers of ameba analyzed: iTY-1, n = 3,303; IL-1β, n = 4,022; C5a, n = 8,385; TNF, n = 7,871; TNF + Ab-1, n = 7,527; TNF + sTNFRI, n = 1,677; TNF + nsAb, n = 1,927. (c) Normalized cumulative distribution of cell orientations. The distributions of orientations of cells moving toward C5a (6 nM) and TNF (50 nM) were significantly different from the distribution in iTY-1 (P < 0.0006 for C5a and P < 0.0025 for TNF). In absence of chemotaxis (iTY-1), the median angle value was 54.0°. In presence of a C5a or TNF gradient, the median angle values were 28.2° and 38.8°, respectively, showing that the majority of cells oriented preferentially along the gradient, as expected for chemotaxis. Total numbers of amebae analyzed: iTY-1, n = 86; C5a, n = 68; TNF, n = 112.

