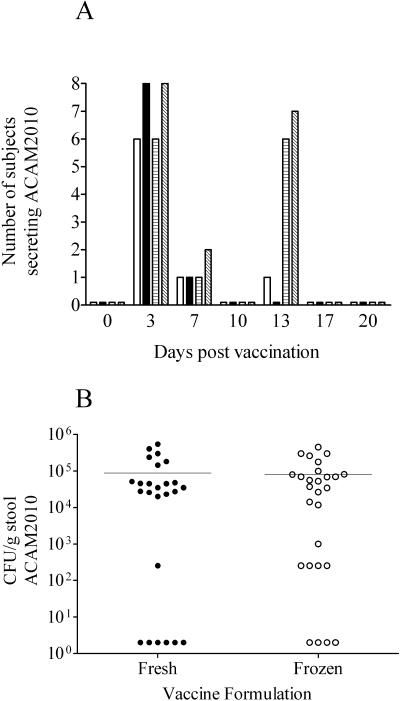
FIG. 3.
Shedding of vaccine strains following ingestion of one or two doses of fresh or frozen ACAM2010. Stool samples obtained from subjects were cultured for the presence of ACAM2010. Graph A shows the number of subjects at each time point following vaccination from which the vaccine strain was recovered: open bars, one dose of fresh vaccine; filled bars, one dose of frozen vaccine; hatched bars, two doses of fresh vaccine; diagonally hatched bars, two doses of frozen vaccine. Graph B shows the levels of shedding in CFU per gram of stool estimated from samples taken 3 days following ingestion of a first or second dose of ACAM2010. Negative stool samples are plotted as 2 CFU. Horizontal bars indicate the mean response in each group.

