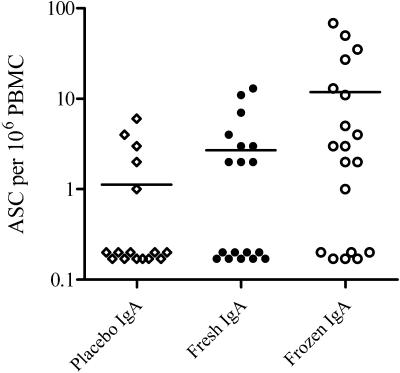
FIG. 4.
IgA CFA/I-specific ASC responses in recipients of one or two doses of ACAM2010. Shown is a dot plot showing the maximal response seen at day 7 or day 10 in individual subjects following ingestion of one or two doses of ACAM2010 at the highest dose level (third cohort in phase A and all subjects in phase B). Responses are plotted after subtraction of the response on the day of the appropriate vaccination; zero or negative responses are plotted as 0.2. Horizontal bars indicate the mean response in each group.

