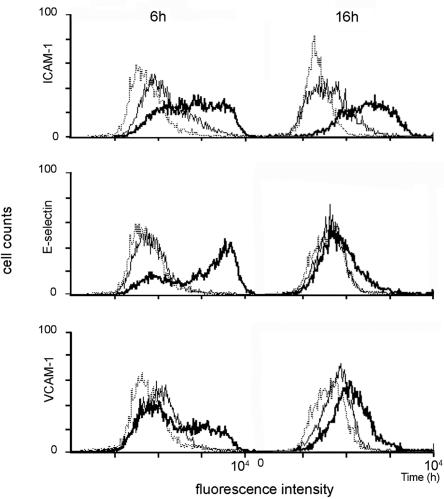
FIG. 4.
Time-dependent expression of adhesion molecules on stimulated HUVECs. A confluent monolayer of HUVECs (1 × 10⁵ cells) was treated with culture medium (solid line) or rGTFC (25 μg ml−1; heavy solid line) for 6 h or 16 h. The cells stained with secondary antibody served as a negative control (dot line). Cell surface expression of adhesion molecules was determined by indirect immunofluorescence and FACS analysis. Representative histograms are shown. The x axis indicates relative fluorescence intensity on a logarithmic scale; the y axis shows the number of cells on a linear scale. A total of 104 cells were analyzed for each histogram.

