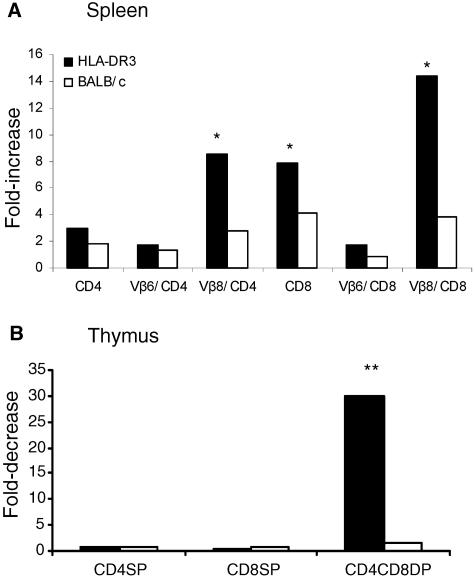
FIG. 1.
T-cell responses following systemic SEB challenge. Age-matched BALB/c or HLA-DR3 transgenic mice were challenged with a single intraperitoneal injection of 10 μg of SEB. Mice were sacrificed 3 days later, and the distributions of different T-cell subsets in the spleen (A) or thymus (B) were enumerated by flow cytometry. Bars indicate ratios between absolute numbers of cells in PBS-treated and SEB-treated mice. Each bar represents the mean of four mice/group. *, P < 0.05; **, P < 0.001; SP, single positive; DP, double positive.

