
Figure 12.
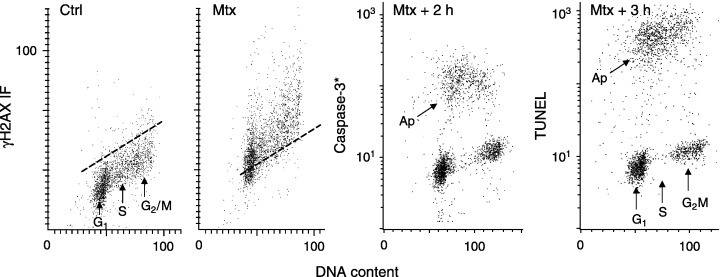
H2AX phosphorylation and induction of apoptosis in HL‐60 cells treated with topo2 inhibitor mitoxantrone (Mtx) in relation to the cell cycle phase. The two left panels show bivariate distributions of γH2AX IF versus DNA content of the untreated (Ctrl) HL‐60 cells and cells treated with 0.15 µg/mL Mtx for 2 h. The MTX‐treated cells were further incubated and activation of caspase‐3 (caspase‐3*) and the presence of apoptosis‐associated DNA strand breaks (TUNEL) were assessed after an additional 2 and 3 h, respectively, combined with DNA content measurements (two right panels) Note an increase in γH2AX IF occurring in all phases of the cell cycle, after the Mtx treatment. However, S‐phase cells preferentially undergo apoptosis (Ap) as is evident from the pattern of caspase‐3 activation and the presence of DNA strand breaks detected by TUNEL, vis‐à‐vis cell cycle phase.