
Figure 6.
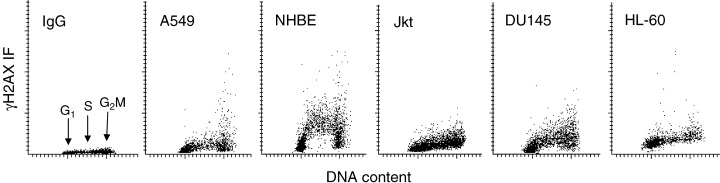
Variable level of ‘programmed’γH2AX expression in different cell types. Bivariate distributions (scatterplots) representing DNA content versus γH2AX IF of human cells from untreated exponentially growing lung carcinoma A549, normal bronchial epithelial (NHBE), T‐cell leukaemic Jurkat (Jkt), prostate carcinoma DU145 and promyelocytic leukaemic HL‐60 cell cultures. IgG shows the negative isotype control (A549 cells). Note differences in extent and in pattern of γH2AX expression vis‐à‐vis the cell cycle phase in different cell types. NHBE cells in S‐phase of the cycle exhibit particularly high expression of γH2AX.