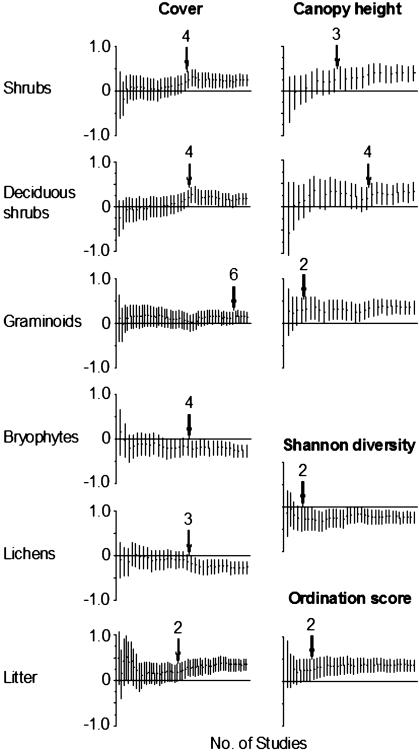
Fig. 3.
Response of tundra plant community variables that showed a significant main response to warming partitioned by duration of the warming experiments. The values represent the mean effect size and 95% confidence interval of a series of metaanalyses where studies were added successively to the analysis based on the number of growing seasons of warming. The arrows indicate the growing season of warming in which the effect became significant. The ordination score is based on the raw cover values. The number of seasons of warming at each site is given in Table 1.

