FIG. 5.
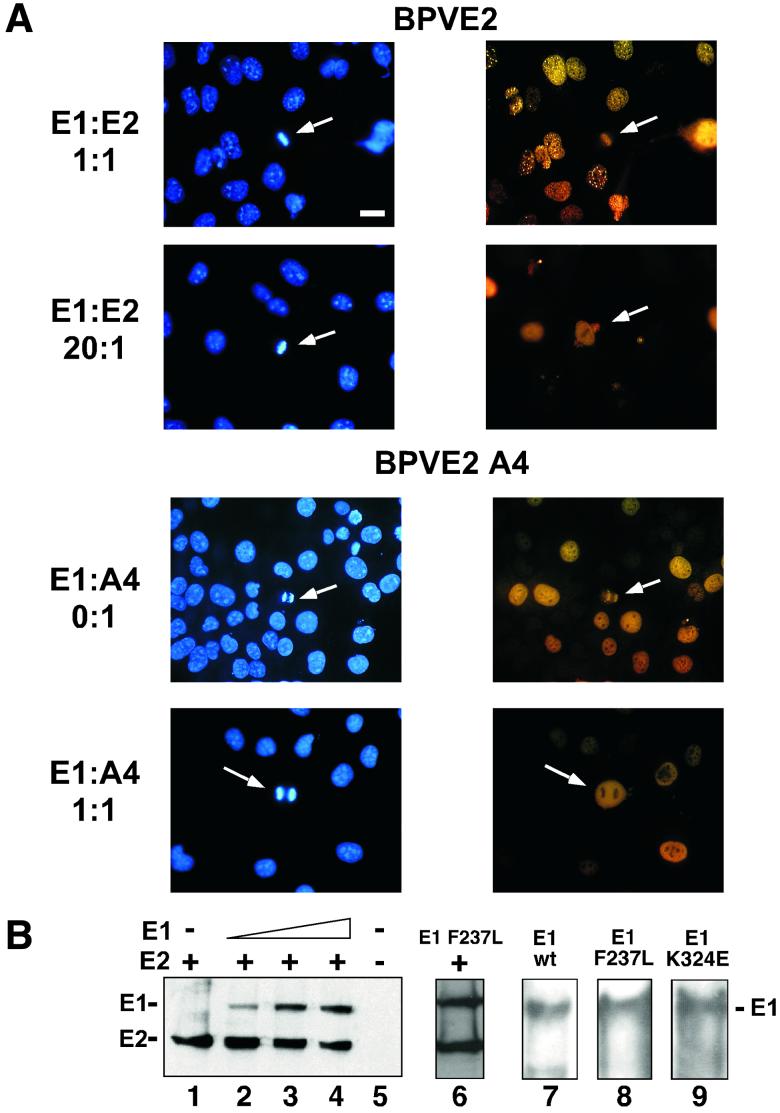
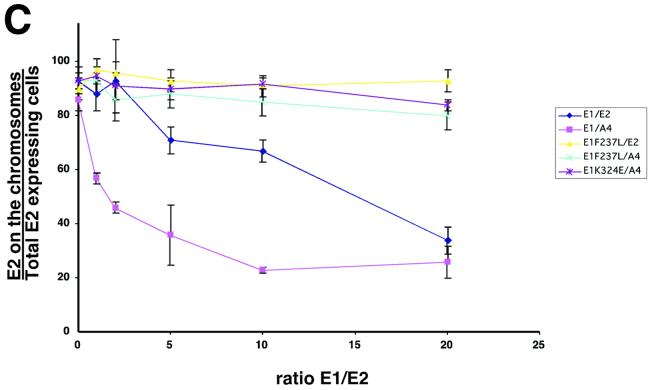
E1 expression is sufficient for E2 delocalization from mitotic chromosomes. (A) COS-7 cells were grown on cover slips and infected with a constant amount of PAVA-E2 or PAVA-A4 (1 MOI) and increasing amounts of PAVA-E1 (0 to 20 MOI). After 24 h, the cells were fixed, and E2 was detected by immunofluorescence. The panels show representative fields of E2 distribution for the outlined E1/E2 ratios. Right side, E2 immunostaining (yellow); left side, DAPI staining (blue). Bar, 20 μm. (B) Immunoblot analysis of PAVA-E2- and PAVA-E1-infected cell extracts. For detection, both the E1- and E2-specific monoclonal antibodies were used. Shown are extracts derived from COS-7 cell infections using constant amounts of PAVA-E2 (1 MOI) and increasing amounts of PAVA-E1 (0, 5, 10, and 20 MOI) (lanes 1 to 4, respectively), as well as mock-infected extracts (lane 5). At the levels of expression used for these and subsequent experiments, no differences in E2-A4 or wild-type levels were detected (data not shown). Lane 6 shows the level of the E1F237L mutant protein (10 MOI) and E2 (1 MOI). The points at which mutant and wild-type E1 accumulate to the same level as E2 are equivalent. Lanes 7 through 9 show the level of E1 that accumulated at an MOI of 10 for the wild-type, E1-F237L, and E1-K235E alleles in side-by-side infections from total cell extracts. The positions of the E1 and E2 protein bands are indicated on the left side of the panel. (C) Quantitative evaluation of the dislocation of the E2 proteins by wild-type and mutant E1 proteins. For each ratio of E1- and E2-encoding viruses, approximately 60 mitotic cells that were positive for E2 protein were examined for E2 localization. The percentage of mitotic cells that had chromosomally located E2 was plotted against the ratio of the two viruses. Shown are averages and the standard deviation for three experiments for each E1-E2 combination. ⧫, wild-type E1/wild-type E2; ▴, E1-F237L/wild-type E2; ▪, wild-type E1/E2-A4; ∗, E1-K324E/E2-A4; ×, E1-F237L/E2-A4).


