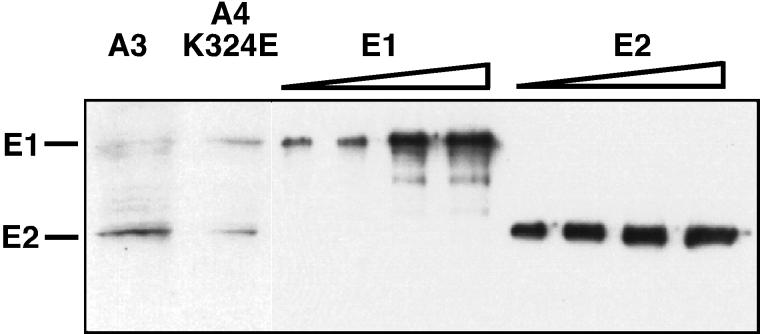
FIG. 7.
E1 and E2 are expressed at comparable levels in stably transformed cells. Shown is an immunoblot analysis of nuclear extracts derived from C127 cells that were transformed with the A3 or the E1-suppressor mutant K324E. The location of the E1 E2 proteins is indicated on the left. Lane1: A3-transformed cells; lane 2: E1 suppressor mutant K324E transformed cells; lanes 3-6: increasing amounts (1, 3, 5, 10 ng) of E. coli produced E1; lanes 7-10: increasing amounts (1, 3, 5, 10 ng) of E. coli produced E2.

