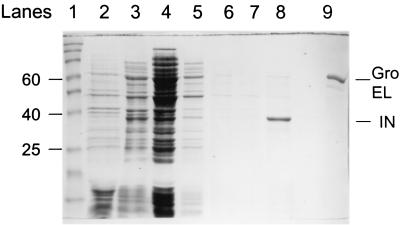
FIG. 2.
Coomassie blue-stained SDS-PAGE gel showing HIV-1 IN coexpressed with protein chaperones at various steps of induction and purification. Lane 1, molecular weight standards from 15 to 190 kDa; lane 2, total-cell lysate uninduced; lane 3, total-cell lysate induced for 3 h; lane 4, supernatant after sonication and centrifugation of lysate; lane 5, supernatant of the second lysate after sonication of the IN-DNA pellet and centrifugation; lane 6, supernatant of the first wash of the pellet; lane 7, supernatant of the second wash of the pellet; lane 8, 1 M NaCl extraction; lane 9, purified GroEL. For lanes 4 to 7, 4 ml of buffer per g wet weight of bacteria was used; for lane 8, the 1 M NaCl extraction buffer volume was 2 ml per g wet weight of bacteria. A constant volume (10 μl) of extract was applied in lanes 4 to 8. The sizes of several molecular mass markers (in kilodaltons) are indicated on the left. Purified GroEL and IN are indicated on the right.

