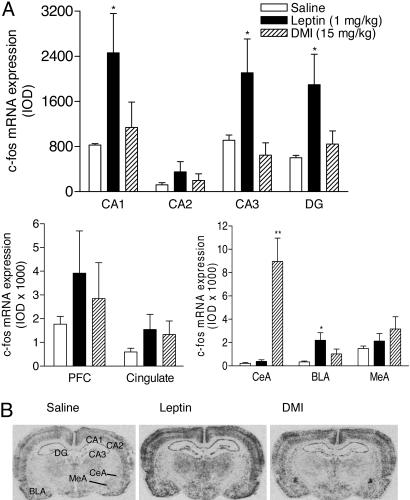
Fig. 4.
c-fos induction in limbic areas in response to treatments with leptin or DMI after the FST. (A) Changes in mRNA levels of c-fos in the hippocampal formation, prefrontal cortex, cingulate cortex, and amygdala after the FST in rats treated with saline, leptin (1.0 mg/kg), or DMI (15 mg/kg) (23.5, 2.5, and 0.5 h before testing, s.c.). IOD, integrated optical density; CA1, CA2, CA3, fields of the hippocampus; DG, dentate gyrus; PFC, prefrontal cortex; CeA, central nucleus of amygdala; BLA, basolateral nucleus of amygdala; MeA, medial nucleus of amygdala. n = 5 per group. *, P < 0.05; **, P < 0.01 compared with saline treatment. (B) Autoradiograms showing c-fos induction in the hippocampal formation and amygdala.

