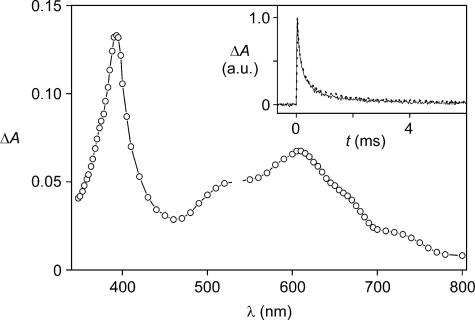
Fig. 2.
Transient UV-visible absorption difference spectrum of a deaerated acetonitrile solution containing 1.0 × 10⁻⁴ mol·liter–1 16+ and 5.0 × 10⁻⁵ mol·liter–1 ptz, recorded 50 μs after 532-nm laser excitation at room temperature. (Inset) Normalized transient absorption decays monitored at 520 (solid line) and 600 (dotted line) nm, which correspond to signals assigned to ptz+ and  , respectively.

