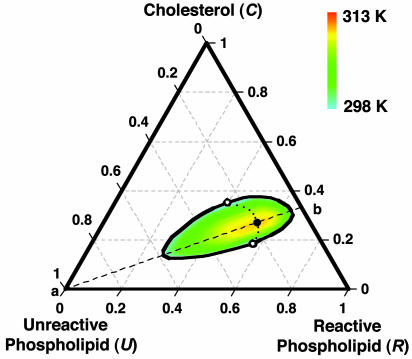
Fig. 1.
Calculated phase diagram of a ternary liquid mixture containing C, R, and U. C and R form a 1:2 complex (one C, two R). The black outline and the open circles denote the isothermal binodal curve and critical points at 298 K. The large filled circle denotes the ternary critical point at 313 K, and the smaller filled circles denote critical points at intermediate temperatures. The diagram is meant to simulate the experimental phase diagram of C, DPPC, and DOPC, for which the observed critical temperature is 313 K (16). See text for best-fit parameters. The dashed line (a–b) denotes the stoichiometric axis where the initial mole fractions of C and R are in a 1:2 ratio. The ternary critical point lies on this line. The calculated tie-lines (not shown) lie along the same directions as those determined experimentally (25).

