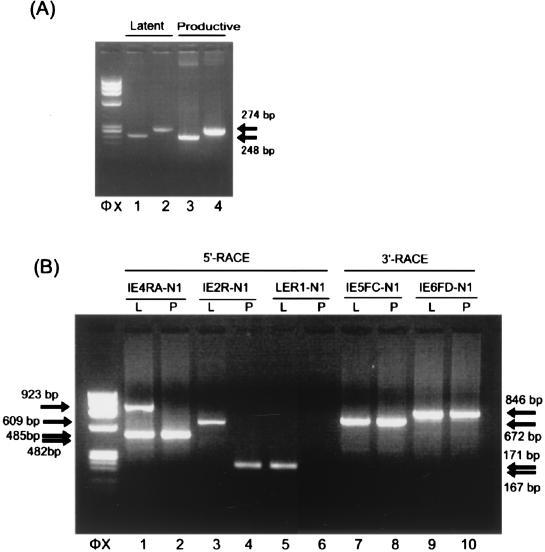
FIG. 2.
Identification of the transcripts arising from the IE1/IE2 locus during latency. (A) Detection of the transcripts arising from the IE1/IE2 locus during latency. HHV-6 gene expression at the IE1/IE2 region in latently infected macrophages and productively infected MT-4 cells was analyzed by RT-PCR. mRNA from 104 latently infected macrophages (lanes 1 and 2) and 102 productively infected MT-4 cells (lanes 3 and 4) was amplified by double-nested RT-PCR with primers IE3FA and IE5RD and IE4FA and IE5RA (lanes 1 and 3) or primers IE3FA and IE6RE and IE4FA and IE6RA (lanes 2 and 4). An ethidium bromide-stained 2% agarose gel is shown. Amplified products of the same size were detected in both the latently infected macrophages and the productively infected MT-4 cells. Arrows indicate the positions of the products. Primer positions are depicted in Fig. 1. φX, HaeIII-digested φX174 DNA. (B) Identification of the 5′ and 3′ ends of the transcripts. mRNA from 105 latently infected macrophages (lanes 1, 3, and 5; labeled L) and from 102 productively infected MT-4 cells (lanes 2, 4, and 6; labeled P) was analyzed by the 5′ RACE method. RACE products from the transcripts are shown. The 5′ end of the cDNA made from each transcript was dA-tailed and annealed with an anchor primer, RL-1. Lanes 1 and 2 show the amplified products obtained with primers N2 and IE4RB followed by primers N1 and IE4RA. The 5′ ends of the transcripts that contained exon 2 of IE1/IE2 (Fig. 3) were detected by using primers N2 and IE4RB and then primers N1 and IE2R (lanes 3 and 4). The 5′ end of the transcript that contained exon LE (Fig. 3) was identified with primers N2 and IE4RB followed by primers N1 and LER1 (lanes 5 and 6). A 3′ RACE study of the latently infected cells (lanes 7 and 9; labeled L) and productively infected cells (lanes 8 and 10; labeled P) was performed. The products amplified with primers N2 and IE5FE and primers N1 and IE5FC (672 bp; lanes 7 and 8) and the products amplified with primers N2 and IE6FG and primers N1 and IE6FD (846 bp; lanes 9 and 10) are shown. Similar results were obtained in the 5′ RACE and 3′ RACE study when umbilical cord blood mononuclear cells or Molt-3 cells were used as productively infected cells. Arrows indicate the positions of the RACE products. HaeIII-digested φX174 DNA fragments were used as size markers (φX). L, latently infected macrophages; P, productively infected MT-4 cells.

