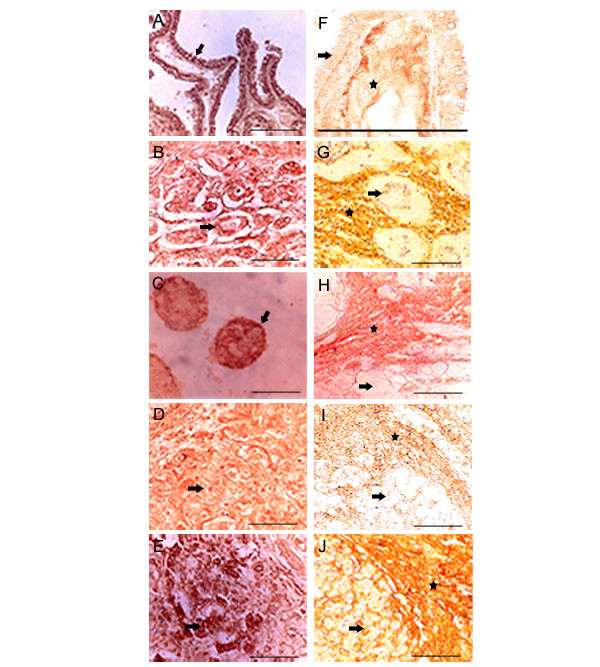
Figure 6.

Comparison of HABP and HA expression in poorly differentiated tumors: HABP expression in poorly differentiated tumors (A, B, C, D, E), A. Thyroid, B. Stomach, C. Descending Colon, D. Urinary bladder, E. Pancreas shows high HABP expression both on tumor cell surface and nucleus. HA expression in poorly differentiated tumors (F, G, H, I, J), F. Thyroid, G. Stomach, H. Descending Colon, I. Urinary bladder, J. Pancreas shows very low HA expression in tumor cells where as the tumor stroma shows high expression of HA. Arrow shows the tumor cells and the asterisk shows stroma. Scale bars, 50 μm.
