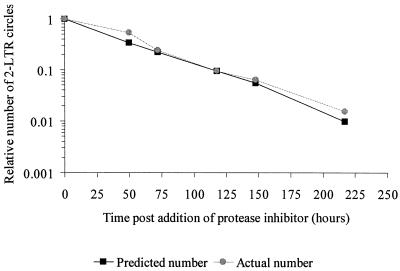
FIG. 2.
Comparison of the rate of observed decline of the 2-LTR circle signal to the decrease in signal predicted, assuming complete stability of the circles and a decrease in concentration as a consequence of dilution from cell division measured during the course of study. Data are normalized to the signal at time zero.

