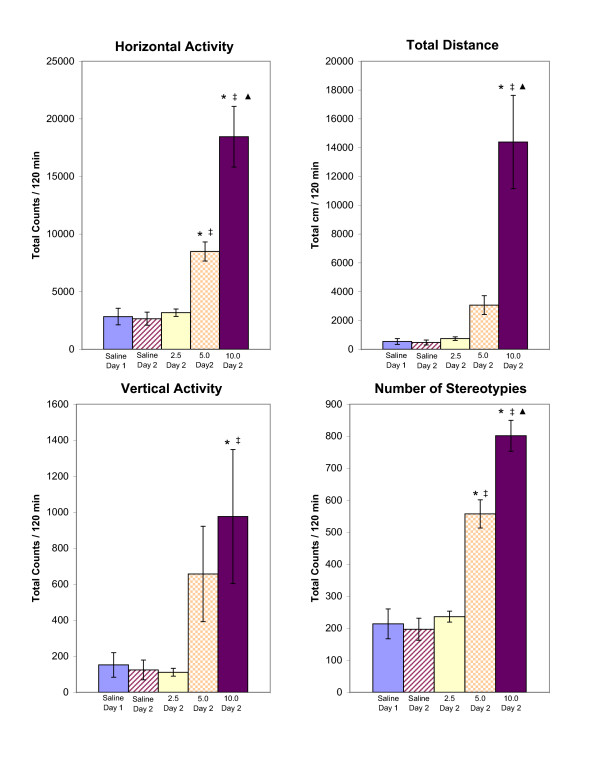
Figure 1.
summarizes the experiments measuring acute dose-response to MDMA (2.5, 5.0, and 10.0 mg/kg, i.p.) for the HA, TD, VA, and NOS locomotor indices. The values are presented as the mean ± S.E.M. *, ‡, and ▲ are for significant differences compared to experimental day 2 saline, 2.5 mg/kg MDMA, and 5.0 mg/kg MDMA, respectively (p < 0.05).

