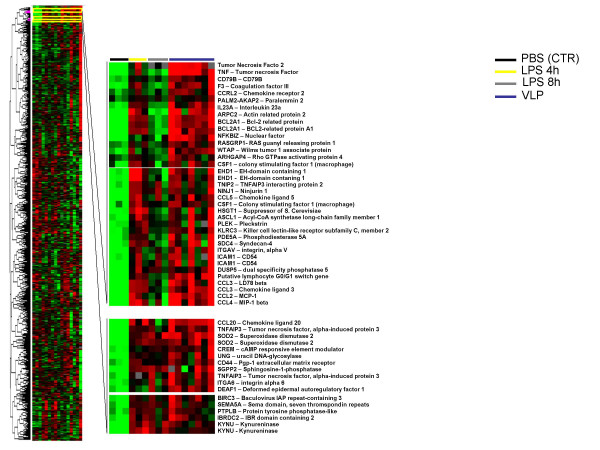
Figure 6.
Supervised hierarchical clustering of genes upregulated by HIV-VLPs and LPS in MDDCs. 3,119 genes included in this analysis were filtered upon the criteria of showing less than 20% missing data and a minimum of 3-fold modulation in expression. The expanded section shows nodes including genes upregulated by HIV-VLPs and LPS-4 h (top) or by HIV-VLPs and LPS (bottom). Individual genes are indicated on the right.

