
Figure 6.
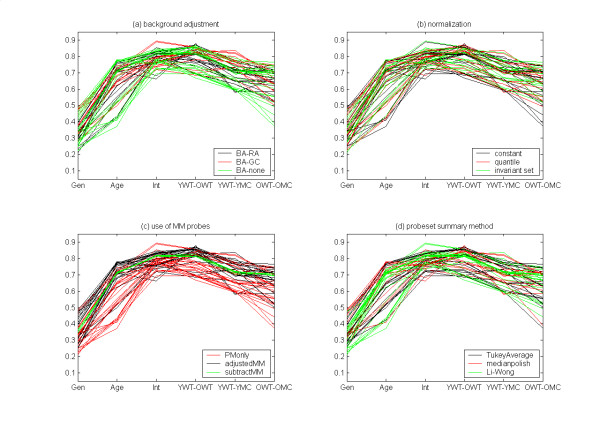
Correlations for each of the six contrasts for 56 combinations. See Table 5 for notation. Curves are colored by (a) the method of background adjustment, (b) the method of normalization, (c) the use of MM probe data, (d) the method for summarizing data across a probeset. No sub-method is clearly uniformly superior.