
Figure 1.
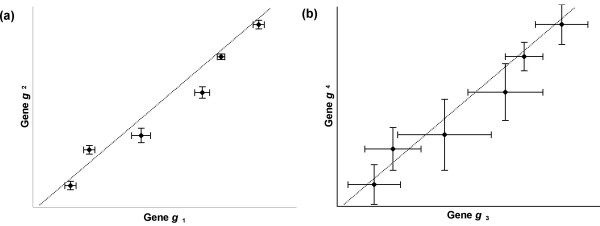
Scatter plots of gene expression profiles. (a) A scatter plot of the expression profiles for 2 genes (with 6 components) with standard errors indicated, (b) A scatter plot of the expression profiles for 2 genes (with 6 components) identical to the expression profiles in (a), but with higher standard errors. The gene pairs in (a) and (b) have identical Euclidean distances, identical correlation coefficients, and identical error-weighted similarity. However, in the CORE clustering algorithm, genes whose expression measurements have higher error (g3 or g4) provide less information about which cluster the gene belongs to, and the gene makes less of a contribution toward the calculation of clustering parameters.